
Eclipse Vert.x metrics now with Micrometer.io
Vert.x has already been providing metrics for some time, through the vertx-dropwizard-metrics and vertx-hawkular-metrics modules. Both of them implement a service provider interface (SPI) to collect the Vert.x metrics and make them available to their respective backends.
A new module, vertx-micrometer-metrics, is now added to the family. It implements the same SPI, which means that it is able to provide the same metrics. Micrometer.io is a pretty new metrics library, quite comparable to dropwizard metrics in that it collects metrics in a local, in-memory registry and is able to store them in various backends such as Graphite or InfluxDB. It has several advantages as we will see below.
Tell me more about Micrometer
Micrometer.io describes itself as a a vendor-neutral application metrics facade. It provides a well designed API, in Java, to define gauges, counters, timers and distribution summaries.
Among the available backends, Micrometer natively supports Graphite, InfluxDB, JMX, Prometheus and several others. Prometheus is very popular in the Kubernetes and microservices ecosystems, so its support by Micrometer was a strong motivation for implementing it in Vert.x.
For the the moment, our implementation in Vert.x supports Prometheus, InfluxDB and JMX. More should quickly come in the near future.
Dimensionality
Another interesting aspect in Micrometer is that it handles metrics dimensionality: metrics can be associated with a set of key/value pairs (sometimes refered as tags, sometimes as labels). Every value brings a new dimension to the metric, so that in Prometheus or any other backend that supports dimensionality, we can query for datapoints of one or several dimensions, or query for datapoints aggregated over several dimensions.
Example: our metric vertx_http_server_connections accepts labels local and remote, that are used to store addresses on HTTP connections
Prometheus is used in the following examples, but equivalent queries can be performed with InfluxDB.
In Prometheus, the query vertx_http_server_connections will return as many timeseries as there are combinations of local and remote values. Example:
vertx_http_server_connections{local="0.0.0.0:8080",remote="1.1.1.1"}
vertx_http_server_connections{local="0.0.0.0:8080",remote="2.2.2.2"}
vertx_http_server_connections{local="0.0.0.0:8080",remote="3.3.3.3"}
To query on a single dimension, we must provide the labels:
vertx_http_server_connections{local="0.0.0.0:8080",remote="1.1.1.1"}. It will return a single timeseries.
To get an aggregate, Prometheus (PromQL) provides several aggregation operators:
sum(vertx_http_server_connections) will return the sum across all dimensions.
So what are the Vert.x metrics?
People already familiar with the existing metrics modules (dropwizard or hawkular) will not be too disoriented. They are roughly the same. The main difference is where previously, some metric names could have a variable part within - such as vertx.eventbus.handlers.myaddress - here we take advantage of dimensionality and we will have vertx_eventbus_handlers{address="myaddress"}.
Some other metrics are no longer useful, for instance the dropwizard’s vertx.eventbus.messages.pending, vertx.eventbus.messages.pending-local and vertx.eventbus.messages.pending-remote are now just vertx_eventbus_pending{side=local} and vertx_eventbus_pending{side=remote} in micrometer. The sum of them can easily be computed at query time.
The metrics provided by Vert.x are dispatched into eight big families:
- Net client: distribution summaries of bytes sent and received, number of connections, etc.
- Net server: distribution summaries of bytes sent and received, number of connections, etc.
- HTTP client: counter of requests, response times, etc.
- HTTP server: counter of requests, processing times, etc.
- Event bus: counter of handlers, messages sent and received, etc.
- Pool: for worker pools and some datasource pools, queue size and waiting time, processing time, etc.
- Verticles: number of verticles deployed.
The full list of collected metrics is available here.
Getting started
This section will guide you through a quick setup to run a Vert.x application with Micrometer. The code examples used here are taken from the micrometer-metrics-example in vertx-examples repository, in Java, using maven. But the same could be done with other Vert.x supported languages, as well as gradle instead of maven.
Maven configuration
The configuration and the maven imports will vary according to the backend storage that will be used. For maven, the common part is always:
<dependency>
  <groupId>io.vertx</groupId>
  <artifactId>vertx-micrometer-metrics</artifactId>
  <version>3.5.1</version>
</dependency>
- Then, to report to InfluxDB:
<dependency>
  <groupId>io.micrometer</groupId>
  <artifactId>micrometer-registry-influx</artifactId>
  <version>1.0.0</version>
</dependency>
- Or Prometheus:
<dependency>
  <groupId>io.micrometer</groupId>
  <artifactId>micrometer-registry-prometheus</artifactId>
  <version>1.0.0</version>
</dependency>
<dependency>
  <groupId>io.vertx</groupId>
  <artifactId>vertx-web</artifactId>
  <version>3.5.1</version>
</dependency>
Remark that, since Prometheus pulls metrics from their source, they must be exposed on an HTTP endpoint. That’s why vertx-web is imported here. It is not absolutely necessary (it’s possible to get the metrics registry content and expose it in any other way) but it’s probably the easiest way to do.
- Or JMX:
<dependency>
  <groupId>io.micrometer</groupId>
  <artifactId>micrometer-registry-jmx</artifactId>
  <version>1.0.0</version>
</dependency>
At the moment, it is not possible to report metrics to several backends at the same time. It might be soon implemented.
Setting up Vert.x options
A MicrometerMetricsOptions object must be created and passed to VertxOptions, with one backend configured (though having no backend is possible: you would get metrics sent to a default Micrometer registry, but without any persistent storage).
- InfluxDB example:
// Default InfluxDB options will push metrics to localhost:8086, db "default"
MicrometerMetricsOptions options = new MicrometerMetricsOptions()
  .setInfluxDbOptions(new VertxInfluxDbOptions().setEnabled(true))
  .setEnabled(true);
Vertx vertx = Vertx.vertx(new VertxOptions().setMetricsOptions(options));
// Then deploy verticles with this vertx instance
- Prometheus example:
// Deploy with embedded server: prometheus metrics will be automatically exposed,
// independently from any other HTTP server defined
MicrometerMetricsOptions options = new MicrometerMetricsOptions()
  .setPrometheusOptions(new VertxPrometheusOptions()
    .setStartEmbeddedServer(true)
    .setEmbeddedServerOptions(new HttpServerOptions().setPort(8081))
    .setEnabled(true))
  .setEnabled(true);
Vertx vertx = Vertx.vertx(new VertxOptions().setMetricsOptions(options));
// Then deploy verticles with this vertx instance
- Or Prometheus with the
/metricsendpoint bound to an existing HTTP server:
// Deploy without embedded server: we need to "manually" expose the prometheus metrics
MicrometerMetricsOptions options = new MicrometerMetricsOptions()
  .setPrometheusOptions(new VertxPrometheusOptions().setEnabled(true))
  .setEnabled(true);
Vertx vertx = Vertx.vertx(new VertxOptions().setMetricsOptions(options));

Router router = Router.router(vertx);
PrometheusMeterRegistry registry = (PrometheusMeterRegistry) BackendRegistries.getDefaultNow();
// Setup a route for metrics
router.route("/metrics").handler(ctx -> {
  String response = registry.scrape();
  ctx.response().end(response);
});
vertx.createHttpServer().requestHandler(router::accept).listen(8080);
- JMX example:
// Default JMX options will publish MBeans under domain "metrics"
MicrometerMetricsOptions options = new MicrometerMetricsOptions()
  .setJmxMetricsOptions(new VertxJmxMetricsOptions().setEnabled(true))
  .setEnabled(true);
Vertx vertx = Vertx.vertx(new VertxOptions().setMetricsOptions(options));
// Then deploy verticles with this vertx instance
Setup the backend server
- InfluxDB, by default, is expected to run on
localhost:8086without authentication, database “default”. It is configurable inVertxInfluxDbOptions. If you don’t have a running instance of InfluxDB, the shortest way to start is certainly with docker, just run:
docker run -p 8086:8086 influxdb
- Prometheus needs some configuration since it pulls metrics from the sources. Once it is installed, configure the scrape endpoints in
prometheus.yml:
- job_name: 'vertx-8081'
  static_configs:
    - targets: ['localhost:8081']
or, when using /metrics endpoint bound to an existing HTTP server:
- job_name: 'vertx-8080'
  static_configs:
    - targets: ['localhost:8080']
- For JMX there is nothing special to configure.
Collecting Vert.x metrics
From now on, all Vert.x metrics will be collected and sent to the configured backend. In our Vert.x example, we setup an HTTP server metrics:
Router router = Router.router(vertx);
router.get("/").handler(ctx -> {
  ctx.response().end("Hello Micrometer from HTTP!");
});
vertx.createHttpServer().requestHandler(router::accept).listen(8080);
And some event bus ping-pong:
// Producer side
vertx.setPeriodic(1000, x -> {
  vertx.eventBus().send("greeting", "Hello Micrometer from event bus!");
});
// Consumer side
vertx.eventBus().<String>consumer("greeting", message -> {
  String greeting = message.body();
  System.out.println("Received: " + greeting);
  message.reply("Hello back!");
});
To trigger some activity on the HTTP server, we can write a small bash script:
while true
do curl http://localhost:8080/
    sleep .8
done
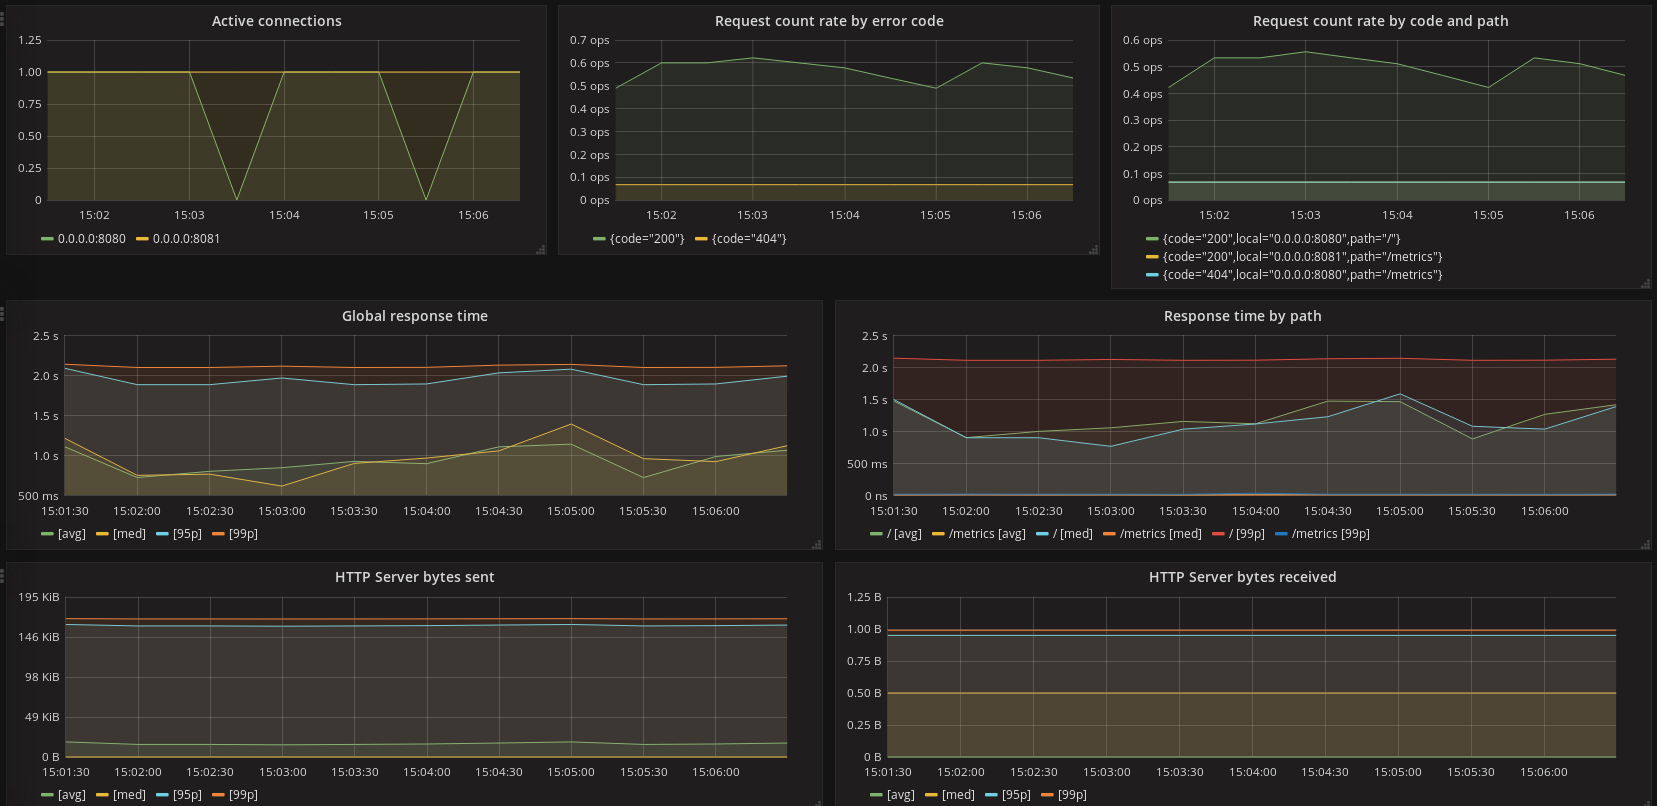
Viewing the results
Grafana can be used to display the InfluxDB and Prometheus metrics. The vertx-examples repository contains two dashboards for that: for InfluxDB and for Prometheus.
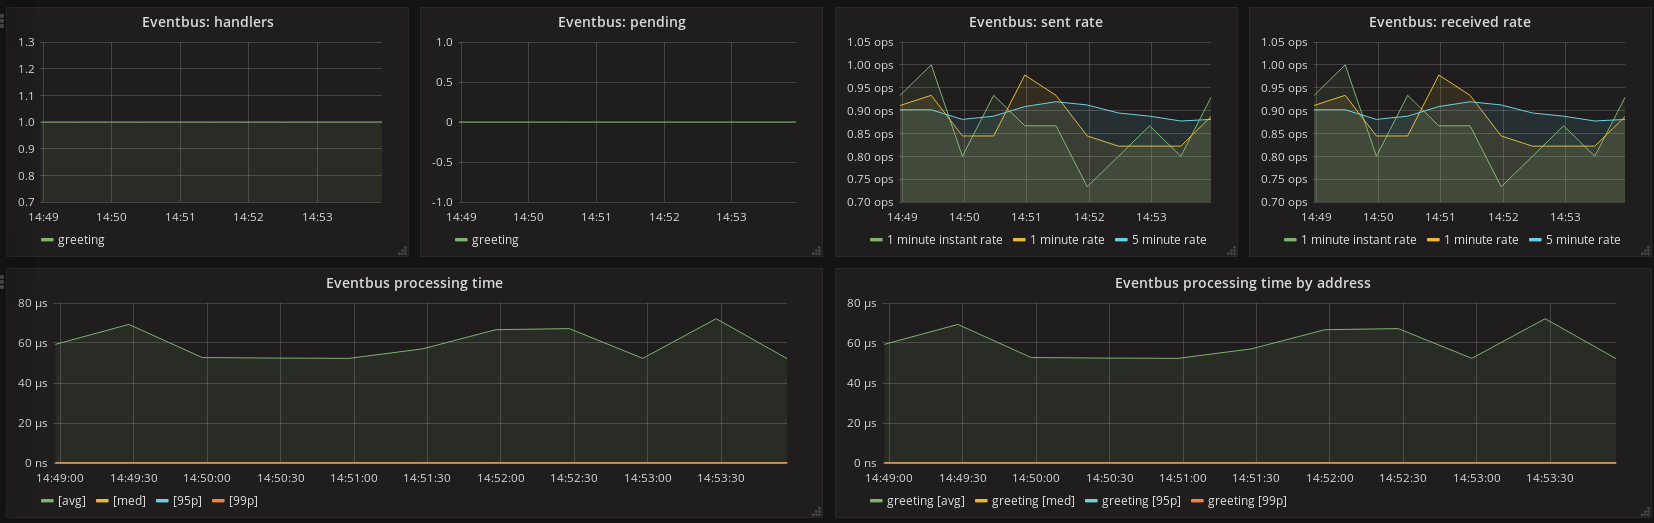
HTTP server metrics
Event bus metrics
Going further
We’ve seen the basic setup. There is a good bunch of options available, detailed in the documentation: how to disable some metrics domains, how to filter or rearrange labels, how to export metrics snapshots to Json objects, how to add JVM or processor instrumentation, etc.
Before we finish, there is one important point that we can cover here: defining custom metrics. Because the module gives you access to its Micrometer registry, you can add your custom metrics there.
Getting the default registry is straightforward:
MeterRegistry registry = BackendRegistries.getDefaultNow();
Then you have plain access to the Micrometer API.
For instance, here is how you can track the execution time of a piece of code that is regularly called:
MeterRegistry registry = BackendRegistries.getDefaultNow();
Timer timer = Timer
  .builder("my.timer")
  .description("Time tracker for my extremely sophisticated algorithm")
  .register(registry);

vertx.setPeriodic(1000, l -> {
  timer.record(() -> myExtremelySophisticatedAlgorithm());
});
Since it is using the same registry, there is no extra backend configuration to do.
What’s next?
The vertx-micrometer-metrics module will continue to be improved, with already two planned enhancements:
- Adding more backends, like Graphite.
- Allow to configure several backends, and not only one at the same time.
Would you miss any feature, please ask on GitHub. Contributions and bug fixes are also welcome!
Now is time to enter the Metrics.

Next post
New community channels

In order to better support the community, we (the core team and module maintainers) now also provide help on Stack Overflow and Gitter.
Read morePrevious post
Google Summer of Code 2018
It's this time of year again! Google Summer of Code 2018 submission period has just started!
Read moreRelated posts
Eclipse Vert.x meets GraphQL

In this blog post, we will look at an example application written in Vert.x that uses the new GraphQL API of Gentics Mesh.
Read moreCombine vert.x and mongo to build a giant

This blog post is part of the introduction to Vert.x series. We are now going to replace this JDBC client by the vertx-mongo-client, and thus connect to a Mongo database.
Read moreGetting started with new fabric8 Vert.x Maven Plugin

The all new fabric8 Vert.x Maven Plugin allows you to setup, package, run, start, stop and redeploy easily with a very little configuration resulting in a less verbose pom.xml.
Read more