
Centralized logging for Vert.x applications using the ELK stack
This post entry describes a solution to achieve centralized logging of Vert.x applications using the ELK stack, a set of tools including Logstash, Elasticsearch, and Kibana that are well known to work together seamlessly.
Preamble
This post was written in context of the project titled “DevOps tooling for Vert.x applications”, one of the Vert.x projects taking place during the 2016 edition of Google Summer of Code, a program that aims to bring together students with open source organizations, in order to help them to gain exposure to software development practices and real-world challenges.
Introduction
Centralized logging is an important topic while building a Microservices architecture and it is a step forward to adopting the DevOps culture. Having an overall solution partitioned into a set of services distributed across the Internet can represent a challenge when trying to monitor the log output of each of them, hence, a tool that helps to accomplish this results very helpful.
Overview
As shown in the diagram below, the general centralized logging solution comprises two main elements: the application server, which runs our Vert.x application; and a separate server, hosting the ELK stack. Both elements are linked by Filebeat, a highly configurable tool capable of shipping our application logs to the Logstash instance, i.e., our gateway to the ELK stack.

App logging configuration
The approach described here is based on a Filebeat + Logstash configuration, that means first we need to make sure our app logs to a file, whose records will be shipped to Logstash by Filebeat. Luckily, Vert.x provides the means to configure alternative logging frameworks (e.g., Log4j, Log4j2 and SLF4J) besides the default JUL logging. However, we can use Filebeat independently of the logging framework chosen.
Log4j Logging
The demo that accompanies this post relies on Log4j2 as the logging framework. We instructed Vert.x to use this framework following the guidelines and we made sure our logging calls are made asynchronous, since we don’t want them to block our application. For this purpose, we opted for the AsyncAppender and this was included in the Log4J configuration together with the log output format described in a XML configuration available in the application’s Resource folder.
<Configuration>
  <Appenders>
    <RollingFile name="vertx_logs" append="true" fileName="/var/log/vertx.log" filePattern="/var/log/vertx/$${date:yyyy-MM}/vertx-%d{MM-dd-yyyy}-%i.log.gz">
      <PatternLayout pattern="%d{ISO8601} %-5p %c:%L - %m%n" />
    </RollingFile>
    <Async name="vertx_async">
      <AppenderRef ref="vertx_logs"/>
    </Async>
  </Appenders>
  <Loggers>
    <Root level="DEBUG">
      <AppenderRef ref="vertx_async" />
    </Root>
  </Loggers>
</Configuration>
Filebeat configuration
Now that we have configured the log output of our Vert.x application to be stored in the file system, we delegate to Filebeat the task of forwarding the logs to the Logstash instance. Filebeat can be configured through a YAML file containing the logs output location and the pattern to interpret multiline logs (i.e., stack traces). Also, the Logstash output plugin is configured with the host location and a secure connection is enforced using the certificate from the machine hosting Logstash. We set the document_type to the type of instance that this log belongs to, which could later help us while indexing our logs inside Elasticsearch.
filebeat:
  prospectors:
    -
      document_type: trader_dashboard
      paths:
        - /var/log/vertx.log
      multiline:
        pattern: "^[0-9]+"
        negate: true
        match: after
output:
  logstash:
    enabled: true
    hosts:
      - elk:5044
    timeout: 15
    tls:
      insecure: false
      certificate_authoritites:
        - /etc/pki/tls/certs/logstash-beats.crt
ELK configuration
To take fully advantage of the ELK stack with respect to Vert.x and our app logs, we need to configure each of its individual components, namely Logstash, Elasticsearch and Kibana.
Logstash
Logstash is the component within the ELK stack that is in charge of aggregating the logs from each of the sources and forwarding them to the Elasticsearch instance.
Configuring Logstash is straightforward with the help of the specific input and output plugins for Beats and Elasticsearch, respectively.
In the previous section we mentioned that Filebeat could be easily coupled with Logstash. Now, we see that this can be done by just specifying Beat as the input plugin and set the parameters needed to be reached by our shippers (listening port, ssl key and certificate location).
input {
  beats {
    port => 5044
    ssl => true
    ssl_certificate => "/etc/pki/tls/certs/logstash-beats.crt"
    ssl_key => "/etc/pki/tls/private/logstash-beats.key"
  }
}
Now that we are ready to receive logs from the app, we can use Logstash filtering capabilities to specify the format of our logs and extract the fields so they can be indexed more efficiently by Elasticsearch.
The grok filtering plugin comes handy in this situation. This plugin allows to declare the logs format using predefined and customized patterns based in regular expressions allowing to declare new fields from the information extracted from each log line. In the following block, we instruct Logstash to recognize our Log4j pattern inside a message field, which contains the log message shipped by Filebeat. After that, the date filtering plugin parses the timestamp field extracted in the previous step and replaces it for the one set by Filebeat after reading the log output file.
filter {
  grok {
    break_on_match => false
    match =>  [ "message", "%{LOG4J}"]
  }
  date{
    match => [ "timestamp_string", "ISO8601"]
    remove_field => [ "timestamp_string" ]
  }
}
The Log4j pattern is not included within the Logstash configuration, however, we can specify it using predefined data formats shipped with Logstash and adapt it to the specific log formats required in our application, as shown next.
# Pattern to match our Log4j format
SPACING (?:[\s]+)
LOGGER (?:[a-zA-Z$_][a-zA-Z$_0-9]*\.)*[a-zA-Z$_][a-zA-Z$_0-9]*
LINE %{INT}?
LOG4J %{TIMESTAMP_ISO8601:timestamp_string} %{LOGLEVEL:log_level}%{SPACING}%{LOGGER:logger_name}:%{LINE:loc_line} - %{JAVALOGMESSAGE:log_message}
Finally, we take a look at Logstash’s output configuration. This simply points to our elasticsearch instance, instructs it to provide a list of all cluster nodes (sniffing), defines the name pattern for our indices, assigns the document type according to the metadata coming from Filebeat, and allows to define a custom index template for our data.
output {
  elasticsearch {
    hosts => ["localhost"]
    sniffing => true
    manage_template => true
    index => "%{[@metadata][beat]}-%{+YYYY.MM.dd}"
    document_type => "%{[@metadata][type]}"
    template => "/etc/filebeat/vertx_app_filebeat.json"
    template_overwrite => true
  }
}
Elasticsearch
Elasticsearch is the central component that enables the efficient indexing and real-time search capabilities of the stack. To take the most advantage of Elasticsearch, we can provide an indexing template of our incoming logs, which can help to optimize the data storage and match the queries issued by Kibana at a later point.
In the example below, we see an index template that would be applied to any index matching the pattern filebeat-*. Additionally, we declare our new log fields type, host, log_level, logger_name, and log_message, which are set as not_analyzed except for the last two that are set as analyzed allowing to perform queries based on regular expressions and not restricted to query the full text.
{
  "mappings": {
    "_default_": {
      "_all": {
        "enabled": true,
        "norms": {
          "enabled": false
        }
      },
      "dynamic_templates": [
        {
          "template1": {
            "mapping": {
              "doc_values": true,
              "ignore_above": 1024,
              "index": "not_analyzed",
              "type": "{dynamic_type}"
            },
            "match": "*"
          }
        }
      ],
      "properties": {
        "@timestamp": {
          "type": "date"
        },
        "offset": {
          "type": "long",
          "doc_values": "true"
        },
        "type": { "type": "string", "index": "not_analyzed" },
        "host": { "type": "string", "index": "not_analyzed" },
        "log_level": { "type": "string", "index": "not_analyzed" },
        "logger_name": { "type": "string", "index": "analyzed" },
        "log_message": { "type": "string", "index": "analyzed" }
      }
    }
  },
  "settings": {
    "index.refresh_interval": "5s"
  },
  "template": "filebeat-*"
}
Kibana
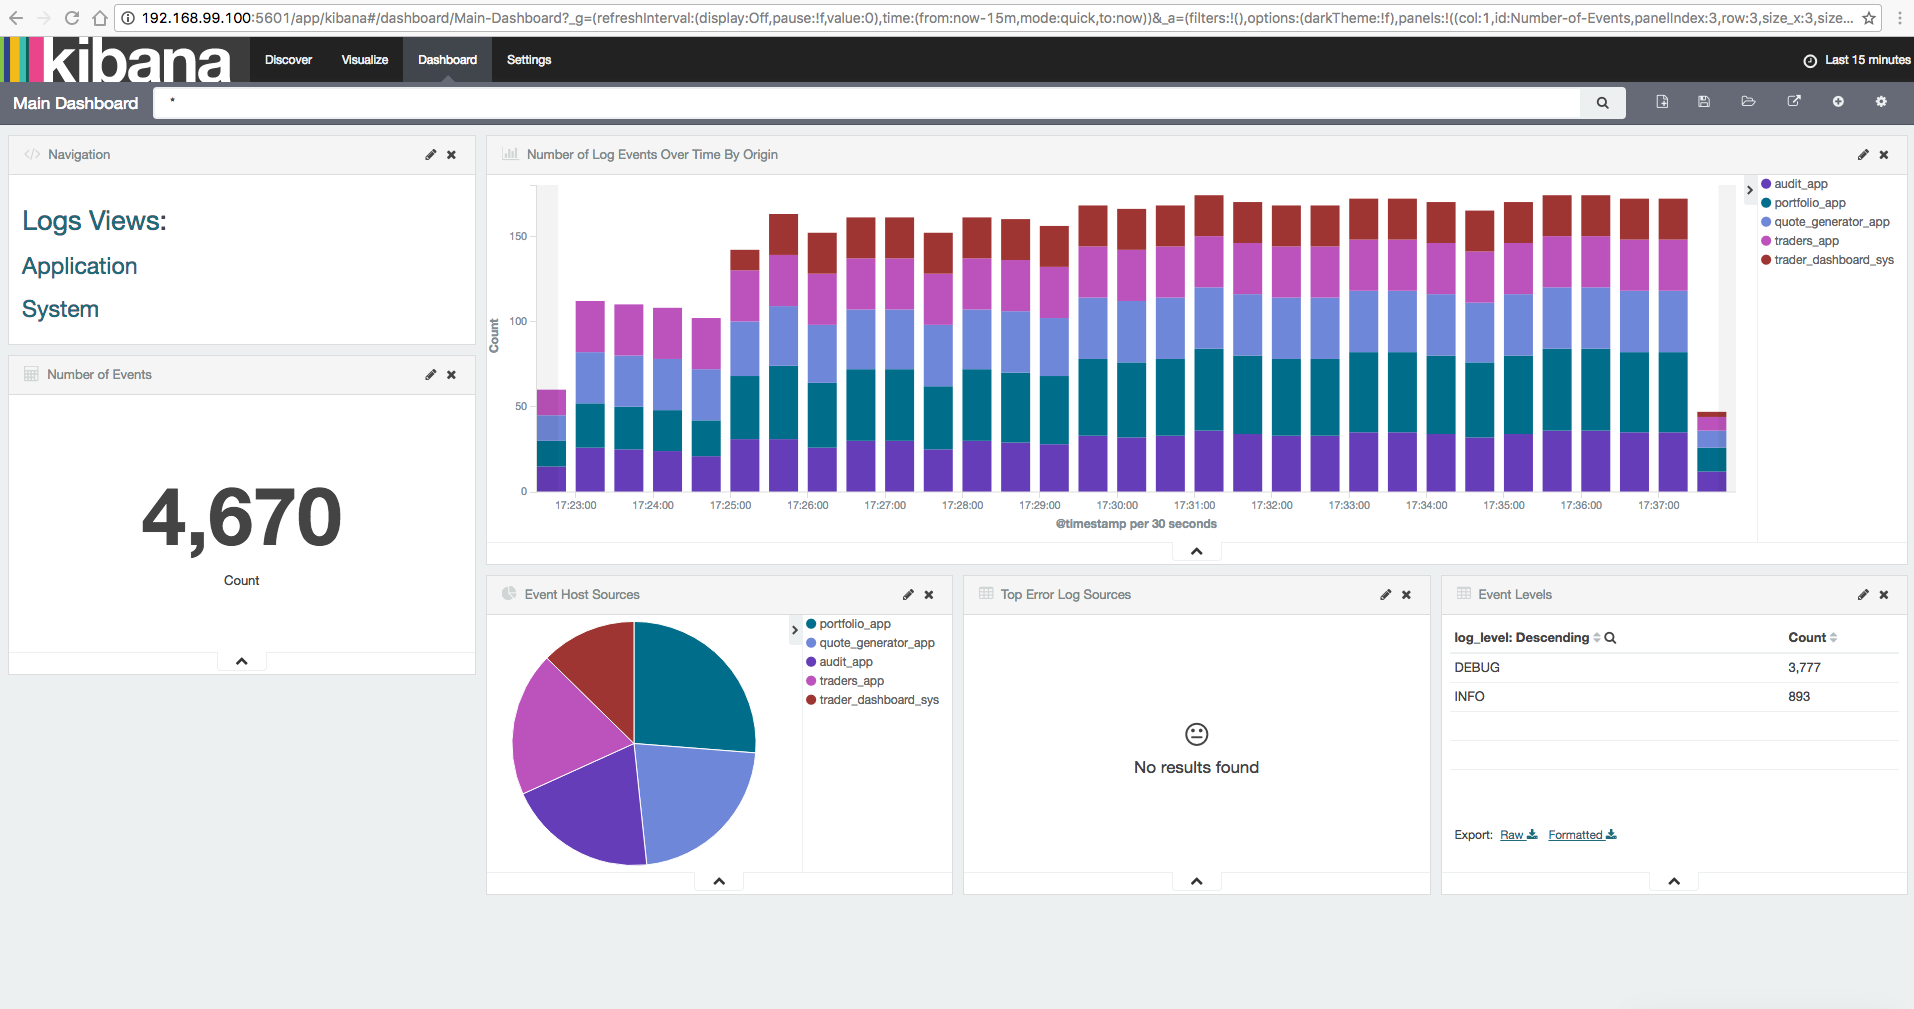
Although we could fetch all our logs from Elasticsearch through its API, Kibana is a powerful tool that allows a more friendly query and visualization. Besides the option to query our data through the available indexed field names and search boxes allowing typing specific queries, Kibana allows creating our own Visualizations and Dashboards. Combined, they represent a powerful way to display data and gain insight in a customized manner. The accompanied demo ships with a couple of sample dashboards and visualizations that take advantage of the log fields that we specified in our index template and throw valuable insight. This includes: visualizing the number of log messages received by ELK, observe the proportion of messages that each log source produces, and directly find out the sources of error logs.
Log shipping challenge
The solution presented here relied on Filebeat to ship log data to Logstash. However, if you are familiar with the Log4j framework you may be aware that there exists a SocketAppender that allows to write log events directly to a remote server using a TCP connection. Although including the Filebeat + Logstash combination may sound an unnecessary overhead to the logging pipeline, they provide a number of benefits in comparison to the Log4j socket alternative:
- The SocketAppender relies on the specific serialization of Log4j’s LogEvent objects, which is no an interchangeable format as JSON, which is used by the Beats solution. Although there are attempts to output the logs in a JSON format for Logstash, it doesn’t support multiline logs, which results in messages being split into different events by Logstash. On the other hand, there is no official nor stable input plugin for Log4j version 2.
- While enabling Log4j’s async logging mode in an application delegates logging operations to separate threads, given their coexistence in the same JVM there is still the risk of data loss in case of a sudden JVM termination without proper log channel closing.
- Filebeat is a data shipper designed to deal with many constraints that arise in distributed environments in a reliable manner, therefore it provides options to tailor and scale this operation to our needs: the possibility to load balance between multiple Logstash instances, specify the number of simultaneous Filebeat workers that ship log files, and specify a compression level in order to reduce the consumed bandwidth. Besides that, logs can be shipped in specific batch sizes, with maximum amount of retries, and specifying a connection timeout.
- Lastly, although Filebeat can forward logs directly to Elasticsearch, using Logstash as an intermediary offers the possibility to collect logs from diverse sources (e.g., system metrics).
Demo
This post is accompanied by a demo based on the Vert.x Microservices workshop, where each of them is shipped in a Docker container simulating a distributed system composed of independent addressable nodes.
Also, the ELK stack is provisioned using a preconfigured Docker image by Sébastien Pujadas.
Following the guidelines in this post, this demo configures each of the Microservices of the workshop, sets up a Filebeat process on each of them to ship the logs to a central container hosting the ELK stack.
Installation
In order to run this demo, it is necessary to have Docker installed, then proceed with:
- Cloning or downloading the demo repository.
- Separately, obtaining the source code of the branch of the Microservices workshop adapted for this demo.
Building the example
The Docker images belonging to the Vert.x Microservices workshop need to be built separately to this project before this project can be launched.
Building the Vert.x Microservices workshop Docker images.
Build the root project and the Trader Dashboard followed by each of the modules contained in the solution folder. Issue the following commands for this:
mvn clean install
cd trader-dashboard
mvn package docker:build
cd ../solution/audit-service
mvn package docker:build
cd ../compulsive-traders
mvn package docker:build
cd ../portfolio-service
mvn package docker:build
cd ../quote-generator/
mvn package docker:build
Running the example
After building the previous images, build and run the example in vertx-elk using the following command:
docker-compose up
The demo
You can watch the demo in action in the following screencast:
Conclusion
The ELK stack is a powerful set of tools that ease the aggregation of logs coming from distributed services into a central server. Its main pillar, Elasticsearch, provides the indexing and search capabilities of our log data. Also, it is accompanied by the convenient input/output components: Logstash, which can be flexibly configured to accept different data sources; and Kibana, which can be customized to present the information in the most convenient way.
Logstash has been designed to work seamlessly with Filebeat, the log shipper which represents a robust solution that can be adapted to our applications without having to make significant changes to our architecture. In addition, Logstash can accept varied types of sources, filter the data, and process it before delivering to Elasticsearch. This flexibility comes with the price of having extra elements in our log aggregation pipeline, which can represent an increase of processing overhead or a point-of-failure. This additional overhead could be avoided if an application would be capable of delivering its log output directly to Elasticsearch.
Happy logging!

Next post
Vert.x 3.3.3 is released!

We have just released Vert.x 3.3.3, a bug fix release of Vert.x 3.3.x.
Read morePrevious post
Vert.x Blueprint Tutorials

The Vert.x Blueprint project aims to provide guidelines to Vert.x users to implement various applications such as message-based applications and microservices.
Read moreRelated posts
Getting started with new fabric8 Vert.x Maven Plugin

The all new fabric8 Vert.x Maven Plugin allows you to setup, package, run, start, stop and redeploy easily with a very little configuration resulting in a less verbose pom.xml.
Read moreVert.x featuring Continuous Delivery with Jenkins and Ansible

This blog entry describes an approach to adopt Continuous Delivery for Vert.x applications using Jenkins and Ansible by taking advantage of the Jenkins Job DSL and Ansible plugins.
Read moreUnit and Integration Tests
Let’s refresh our mind about what we developed so far in the introduction to vert.x series. We forgot an important task. We didn’t test the API.
Read more